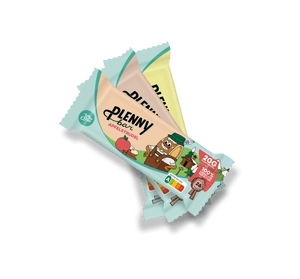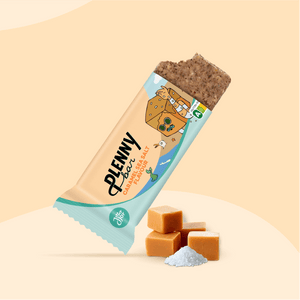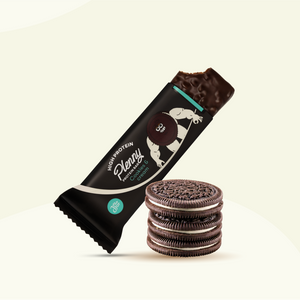
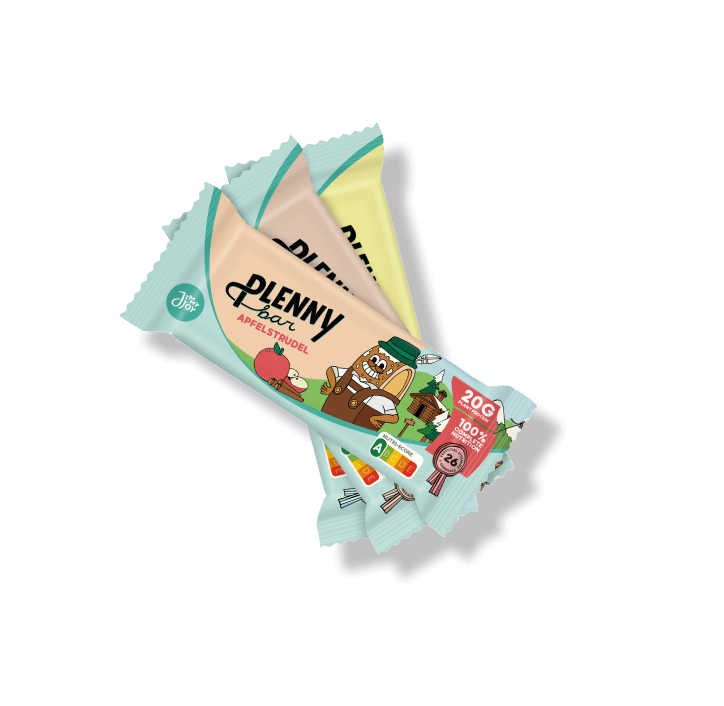
Our mission to create the healthiest meals scientifically possible is never-ending. This year, after a lot of hard work, we accomplished it yet again by creating an even healthier and tastier…
Plenny Bar v3.0!
A new & improved version of all your favourite Plenny Bar flavours, with updates that will blow your socks right off.
Find out all about the changes in this blog!
Our new and improved Plenny Bar v3.0
TL; DR:
- 27% less sugar *
- 9% more fat *
- 30% less saturated fat * (especially in choco: -45%)
- 9% less salt * (especially in CSS: -18%)
- 16% more fibre * (especially in choco: +35%)
- 100% natural flavouring (except Vanilla flavour)
- New & improved mix of vitamins & minerals
- Added probiotics
- Official Nutri-Score A!
* on average
27% Less Sugar
Yesss, in the Plenny Bar v3.0 we managed to have even fewer sugars without losing the amazing Plenny taste! Because of the naturally high-fibre and low-sugar composition of oats, we added more of this superfood. We also completely took out maltodextrin, which we replaced with rice flour. The following flavours are now low in sugar:
- Vanilla (4.9 g)
- Chocolate (4.7 g)
- Caramel Sea Salt (4.3 g)
- Mocha (4.6 g)
9% More Fat & 30% Less Saturated Fat
Because we decreased the sugar content, but needed to keep the Plenny Bar at exactly 400 kcal per bar, we slightly increased the total amount of fat. And by changing from sunflower oil to rapeseed oil, we drastically decreased the amount of saturated fat!
9% Less Salt
We lowered the salt content in the Plenny Bar Caramel Sea Salt from 1.28 g per bar to 1.05 g.
16% More Fibre
With an average of 8.1 g fibre per meal, we increased the fibre content in Plenny Bar with an average of 16%. That makes it high in fibre! The fibre comes from oats, chicory fibre, and soy protein crisps. Fibre increases satiety, helps with your digestion, and improves the health of your intestinal bacteria.
Plenny Bar v2.0 vs v3.0 nutritional info
|
Plenny Bar |
v2.0 |
v3.0 |
|
|
Per portion |
Per portion |
|
Energy kJ |
1674 |
1674 |
|
Kcal |
400 |
400 |
|
Fat |
16 |
18 |
|
from which saturated |
2.2 |
1.5 |
|
Carbohydrates |
38 |
38 |
|
Sugars |
6.4 |
4.6 |
|
Fiber |
7.1 |
8.2 |
|
Protein |
20 |
20 |
|
Salt |
0.87 |
0.80 |
Improved Micronutrient Profile
TL;DR:
- Added probiotics
- Added choline
- 100% natural flavouring (except Vanilla flavour)
- Less vitamin B12
- More Vitamin D
- More Vitamin E
- More Selenium
Added Probiotics
We added probiotics to help strengthen the gut microbiome. Because of the high fibre content in Plenny Bars, the probiotics and fibre have a symbiotic effect: the probiotics feed off the fibre, making them more resistant and providing them with a stronger health effect!
For the v3.0 update, we enhanced Plenny Bars with 500 million cultures of Bacillus Coagulans UABc-20 per meal.
Added Choline
Choline is a relatively recently discovered nutrient: it was only acknowledged as a required nutrient by the Institute of Medicine in 1998.
But choline is involved in many different bodily processes. For example, liver function, healthy brain development, muscle movement, fat transport and metabolism, and DNA synthesis. A deficiency can cause issues like muscle damage, liver damage, and nonalcoholic fatty liver disease (1,2, 4, 5).
That’s why for this update, we outfitted the Plenny Bar with Choline Hydrogen Tartrate. One Plenny Bar v3.0 contains 110mg, which is already 28% of the recommended intake of 400mg/day.
100% Natural Flavouring (except Vanilla flavour)
Chemically speaking, natural flavourings are no different than artificial flavourings, nor are natural flavourings any safer than artificial flavourings [1]. So when it comes to which one is “better”, at Jimmy Joy, we just follow our taste buds, choosing whatever tastes best!
Unfortunately, the 100% natural flavoured Vanilla Bar did not pass our rigorous flavour tests.
You would think that the more vitamins, the better, but there is such a thing as Upper Limits (UL). Your body needs to process all the vitamins, and especially your kidneys have a hard time excreting any overdose of vitamins. Exceeding the Upper Limit of vitamins can cause health problems, so we’re very careful with the amounts we use for our formula.
Vitamin B12
The latest findings on the absorption rate of vitamin B12 made us more curious and after some more research we found out that there can be a saturation in the absorption rate. Active absorption is severely limited. Studies state that the absorption efficiency of B12 is lower when B12 content is higher. (10) They showed that the absorption of B12 varies from about 56%, if about 1 microgram or less is consumed, to about 1.3% for doses of 1000 micrograms (1 milligram) or above.
Studies specifically done on cyanocobalamin estimated the absorptive capacity of cyanocobalamin as 49% and another study as 1.5–2.5 μg per meal, which depends on the maximum saturation of the intestine receptors. This is why we decided to lower the amounts added but, of course, make sure that the daily needs and requirements are met. (11-15) In persons with normal absorption, an intake of 4–7 ug of vitamin B12 a day is associated with an adequate vitamin B12 status. (16)
Reviews from EFSA conclude that supplements available on the market usually contain dosages between 1-5 µg. (17) An appropriate overdosing based on the bioavailability of different vitamin forms is 2-4 times more than the established adequate intake (which is 4ug for B12) without exceeding any upper limits if established.
The National Centre for Biotechnology Information states that cyanocobalamin losses in urine have been observed to be 3 times higher than that of methylcobalamin. Although absorption in the blood of both B12 forms was similar, it was found that methylcobalamin supplementation caused 13% more cobalamin to be stored in the liver than did cyanocobalamin supplementation. (17-19)
We opt for cyanocobalamin produced through fermentation due to its suitability for our intended use, and taking into account the previous, at 4 times higher than the daily recommended intakes.
Therefore, in one portion of Plenny Shake you can find 3,2ug of vitamin B12, which accounts to 128% of the daily recommended intake. Sufficiently enough, don't you think?
Vitamin E, D
Because it's an antioxidant and because of its preservative qualities, we increased Vitamin E. We also increased the vitamin D content, so you’re less dependent on a daily dose of sunlight. Take that, sun!
Selenium
We also increased Selenium in order to meet the latest adequate intake of 70ug/day, established by EFSA (20).
Official Nutri-Score A
All Plenny Bars get an A on the Nutri-Score chart. And yes, that’s the highest score.
Plenny Bar v2.0 vs v3.0 vitamins & minerals
|
Plenny Bar |
|
V2.0 |
V3.0 |
||
|
Vitamins-Minerals |
Unit |
Per portion |
RI* (%) |
Per portion |
RI * (%) |
|
Vitamin A |
μg |
160 |
20% |
160 |
20% |
|
Vitamin D |
μg |
3 |
61% |
5 |
100% |
|
Vitamin E |
mg |
2.4 |
20% |
4 |
33% |
|
Vitamin K |
μg |
16 |
21% |
16 |
21% |
|
Vitamin C |
mg |
40 |
50% |
40 |
50% |
|
Thiamin |
mg |
0.2 |
20% |
0.4 |
36% |
|
Riboflavin |
mg |
0.3 |
23% |
0.3 |
23% |
|
Niacin |
mg |
3.6 |
23% |
3.6 |
23% |
|
Vitamin B6 |
mg |
0.3 |
22% |
0.4 |
29% |
|
Folic Acid |
μg |
60 |
30% |
60 |
30% |
|
Vitamin B12 |
μg |
28 |
1120% |
3.2 |
128% |
|
Biotin |
μg |
10 |
20% |
10 |
20% |
|
Pantothenic acid |
mg |
1.2 |
20% |
1.2 |
20% |
|
Potassium |
mg |
400 |
20% |
400 |
20% |
|
Chloride |
mg |
160 |
20% |
279 |
35% |
|
Calcium |
mg |
185 |
23% |
185 |
23% |
|
Phosphorus |
mg |
140 |
20% |
140 |
20% |
|
Magnesium |
mg |
75 |
20% |
75 |
20% |
|
Iron |
mg |
3.2 |
23% |
3.2 |
23% |
|
Zinc |
mg |
2 |
20% |
2 |
20% |
|
Copper |
mg |
0.2 |
20% |
0.4 |
40% |
|
Manganese |
mg |
0.4 |
20% |
1 |
50% |
|
Selenium |
μg |
11 |
20% |
18 |
33% |
|
Chromium |
μg |
8 |
20% |
8 |
20% |
|
Molybdenum |
μg |
13 |
26% |
13 |
26% |
|
Iodine |
μg |
30 |
20% |
30 |
20% |
* % of the daily reference intake (RI) for vitamins and minerals.
Sources
- NPR.org. (2017). Is “Natural Flavor” Healthier Than “Artificial Flavor”? [online] Available at: https://www.npr.org/sections/thesalt/2017/11/03/560048780/is-natural-flavor-healthier-than-artificial-flavor [Accessed 22 Oct. 2021].
- Zeisel SH, Corbin KD. Choline. In: Erdman JW, Macdonald IA, Zeisel SH, eds. Present Knowledge in Nutrition. 10th ed. Washington, DC: Wiley-Blackwell; 2012:405-18.
- Institute of Medicine. Food and Nutrition Board. Dietary Reference Intakes: Thiamin, Riboflavin, Niacin, Vitamin B6, Folate, Vitamin B12, Pantothenic Acid, Biotin, and Choline. Washington, DC: National Academy Press; 1998.
- Zeisel SH. Choline. In: Coates PM, Betz JM, Blackman MR, et al., eds. Encyclopedia of Dietary Supplements. 2nd ed. London and New York: Informa Healthcare; 2010:136-43
- Zeisel SH. Choline. In: Ross AC, Caballero B, Cousins RJ, Tucker KL, Ziegler TR, eds. Modern Nutrition in Health and Disease. 11th ed. Baltimore, MD: Lippincott Williams & Wilkins; 2014:416-26.
- Corbin KD, Zeisel SH. Choline metabolism provides novel insights into nonalcoholic fatty liver disease and its progression. Curr Opin Gastroenterol 2012;28:159-65. [PubMed abstract]
- Holscher H. D. (2017). Dietary fiber and prebiotics and the gastrointestinal microbiota. Gut microbes, 8(2), 172–184. https://doi.org/10.1080/19490976.2017.1290756
- Raila, J., & Schweigert, F. J. (2001). Zur Bedeutung der Nieren im Vitamin-Stoffwechsel [The role of the kidneys in vitamin metabolism]. Berliner und Munchener tierarztliche Wochenschrift, 114(7-8), 257–266.
- Naik, M. A., Banday, K. A., Najar, M. S., Reshi, A. R., & Bhat, M. A. (2008). Vitamin D intoxication presenting as acute renal failure. Indian journal of nephrology, 18(3), 125–126. https://doi.org/10.4103/0971-4065.43693
- Multiple vitamin overdose: MedlinePlus Medical Encyclopedia. Medlineplus.gov. Retrieved 7 July 2020, from https://medlineplus.gov/ency/article/002596.htm.
- Adams, J. F., Ross, S. K., Mervyn, L., Boddy, K., & King, P. (1971). Absorption of cyanocobalamin, coenzyme B 12 , methylcobalamin, and hydroxocobalamin at different dose levels. Scandinavian journal of gastroenterology, 6(3), 249–252. https://doi.org/10.3109/00365527109180702
- Rizzo, G.; Laganà, A.S.; Rapisarda, A.M.C.; La Ferrera, G.M.G.; Buscema, M.; Rossetti, P.; Nigro, A.; Muscia, V.; Valenti, G.; Sapia, F.; Sarpietro, G.; Zigarelli, M.; Vitale, S.G. Vitamin B12 among Vegetarians: Status, Assessment and Supplementation. Nutrients 2016, 8, 767.
- Institute of Medicine. 1998. Dietary Reference Intakes for Thiamin, Riboflavin, Niacin, Vitamin B6, Folate, Vitamin B12, Pantothenic Acid, Biotin, and Choline. Washington, DC: The National Academies Press. doi: 10.17226/6015. https://www.nap.edu/read/6015/chapter/11#309
- Scott JM. Bioavailability of vitamin B12. Eur J Clin Nutr 51(Suppl 1): S49–S53, 1997.
- Bor, Mustafa & Castel-Roberts, Kristina & Kauwell, Gail & Stabler, Sally & Allen, Robert & Maneval, David & Bailey, Lynn & Nexø, Ebba. (2010). Daily intake of 4 to 7 g dietary vitamin B-12 is associated with steady concentrations of vitamin B-12-related biomarkers in a healthy young population. The American journal of clinical nutrition. 91. 571-7. 10.3945/ajcn.2009.28082.
- Watanabe, F. (2007). Vitamin B12 Sources and Bioavailability. Experimental Biology And Medicine, 232(10), 1266-1274. https://doi.org/10.3181/0703-mr-67
- Bor MV, von Castel-Roberts KM, Kauwell GP, et al. Daily intake of 4 to 7 microg dietary vitamin B-12 is associated with steady concentrations of vitamin B-12-related biomarkers in a healthy young population. Am J Clin Nutr. 2010;91(3):571-577. doi:10.3945/ajcn.2009.28082
- European Food Safety Authority. Tolerable upper intake levels for vitamins and minerals. Scientific Committee on Food Scientific Panel on Dietetic Products, Nutrition and Allergies. 2006 http://www.efsa.europa.eu/sites/default/files/assets/ndatolerableuil.pdf
- Adams, J. F., Ross, S. K., Mervyn, L., Boddy, K., & King, P. (1971). Absorption of Cyanocobalamin, Coenzyme B12, Methylcobalamin, and Hydroxocobalamin at Different Dose Levels. Scandinavian Journal of Gastroenterology, 6(3), 249–252.
- Carmel, R. (2008). How I treat cobalamin (vitamin B12) deficiency. Blood, 112(6), 2214–2221. https://doi.org/10.1182/blood-2008-03-040253
- EFSA Panel on Dietetic Products, N. and A. (NDA). (2014). Scientific Opinion on Dietary Reference Values for selenium. EFSA Journal, 12(10), 3846. https://doi.org/10.2903/j.efsa.2014.3846

 Everything You Need In One Meal
 Stay Full For 3-5 Hours







 Product added to cart


